
To Tree or Not to Tree: Technical Documentation
Analyzing municipal policies & developing a policy-based GIS tool to help cities "releaf" through urban afforestation and canopy rehabilitation.
Abstract
Urban trees are widely recognized for their environmental, social, and infrastructural benefits—but determining where they can realistically be planted is far from straightforward. Traditional land classification methods often overestimate plantable space by overlooking factors like underground utilities, active land use, and legal or policy-based restrictions. This project introduces a GIS-based workflow that redefines urban planting feasibility through the lens of both municipal code and cultural land-use norms.Using St. Paul, Minnesota as a case study, the analysis integrates raster and vector data to categorize land as plantable, non-plantable, tree-covered, or water. These initial classifications are refined using spatial buffers derived from city ordinances—such as right-of-way minimums or utility clearance zones—as well as informal cultural patterns, including the exclusion of active sports fields, recreational infrastructure, and other spaces where tree planting would be functionally inappropriate.Public versus private ownership is then layered into the model to reveal not just where trees could go, but who has the authority or responsibility to plant them.The resulting tool helps bridge the gap between perceived and actual planting potential in urban environments. By visualizing these physical, regulatory, and social constraints, it provides a more grounded foundation for urban forestry planning, encourages data-informed decision-making, and supports the development of context-sensitive greening policies that better reflect the realities on the ground.
Background
Building off the groundwork laid by my advisor’s earlier study, this project digs deeper—asking not only where trees could grow, but where planting is truly practical given the messy intersection of code, culture, and canopy.- To view the original study, please click here >
- To view the Mississippi River Region Extension of the study, please click here >
Limitations of a 4-Class System
While the four-class system used in the Connecticut study provides a helpful starting point, it doesn’t reflect the full complexity of urban plantability. Exclusions like existing tree canopy, water bodies, and built structures are straightforward—but cities are layered with infrastructure above and below ground that complicates where trees can actually go. A patch of open grass may appear available but could sit directly above sewer lines, electrical conduits, or fiber infrastructure.At present, there’s no simple way to evaluate whether planting in a given space complies with code or avoids underground conflicts—aside from calling 811 or waiting for a violation. This project aims to close that gap by developing a spatial tool that incorporates policy, infrastructure, and practical constraints upfront—supporting a more informed, legally feasible approach to urban greening.
Planting Restrictions: Code & Culture
In Municipal Design Standards and Urban Tree Planting Space: Case Studies of Cities Along the Mississippi River, planting ordinances from five cities were reviewed to understand how policy guides urban forestry decisions. The results pointed to a lack of consistency: some cities impose detailed restrictions near traffic infrastructure, riparian zones, and utilities, while others provide little more than general guidelines. Most policies focus narrowly on critical public infrastructure, leaving out non-critical systems and private property entirely—highlighting gaps in how tree planting is planned and regulated.Unwritten norms also play a role. Recreational fields, fences, and neighborhood sledding hills are rarely mentioned in municipal code, but are widely understood as no-planting zones. These cultural practices, though informal, strongly influence where trees are actually planted.Once both legal constraints and cultural behaviors are layered together, the picture of what’s truly plantable shifts. Evaluating a city’s canopy potential requires more than measuring green space—it means identifying the space that’s actually usable, factoring in planting regulations, social context, and land ownership.
GIS Analysis: Is it Tree-asonable?
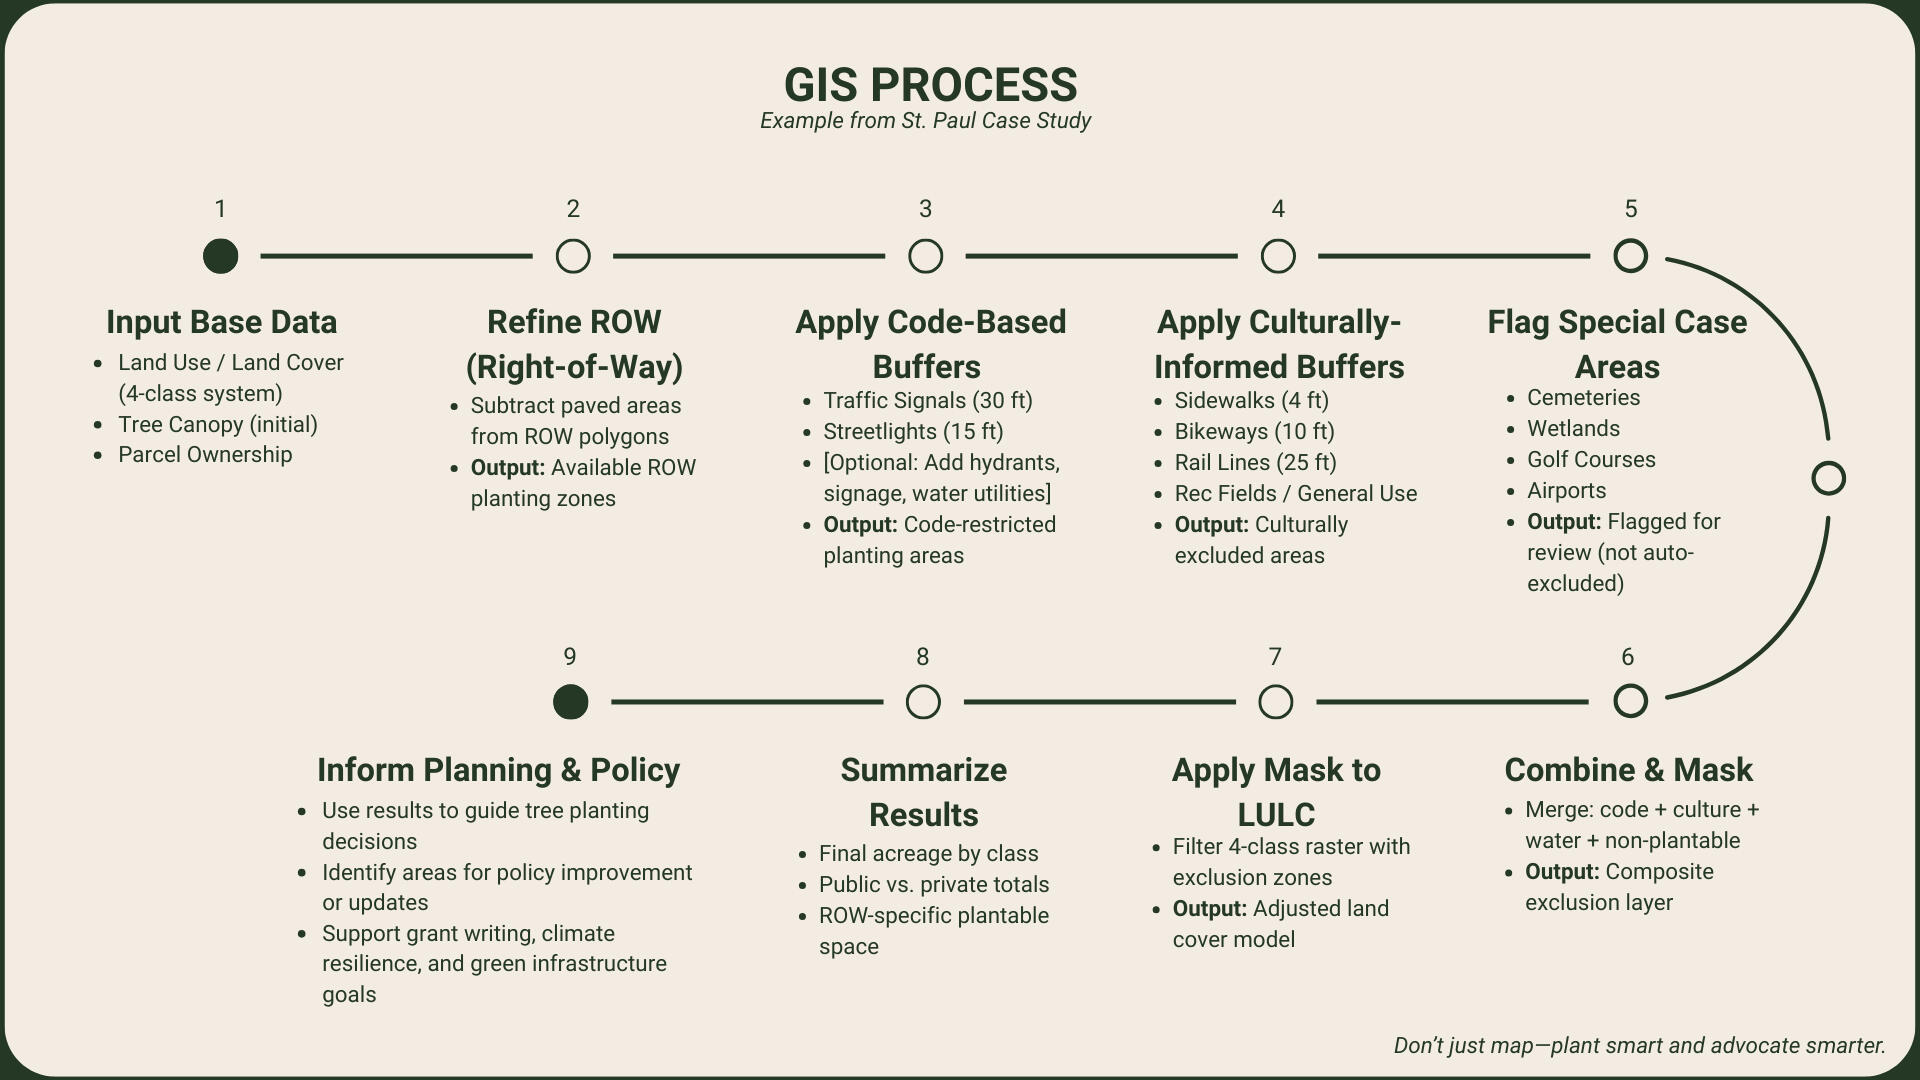
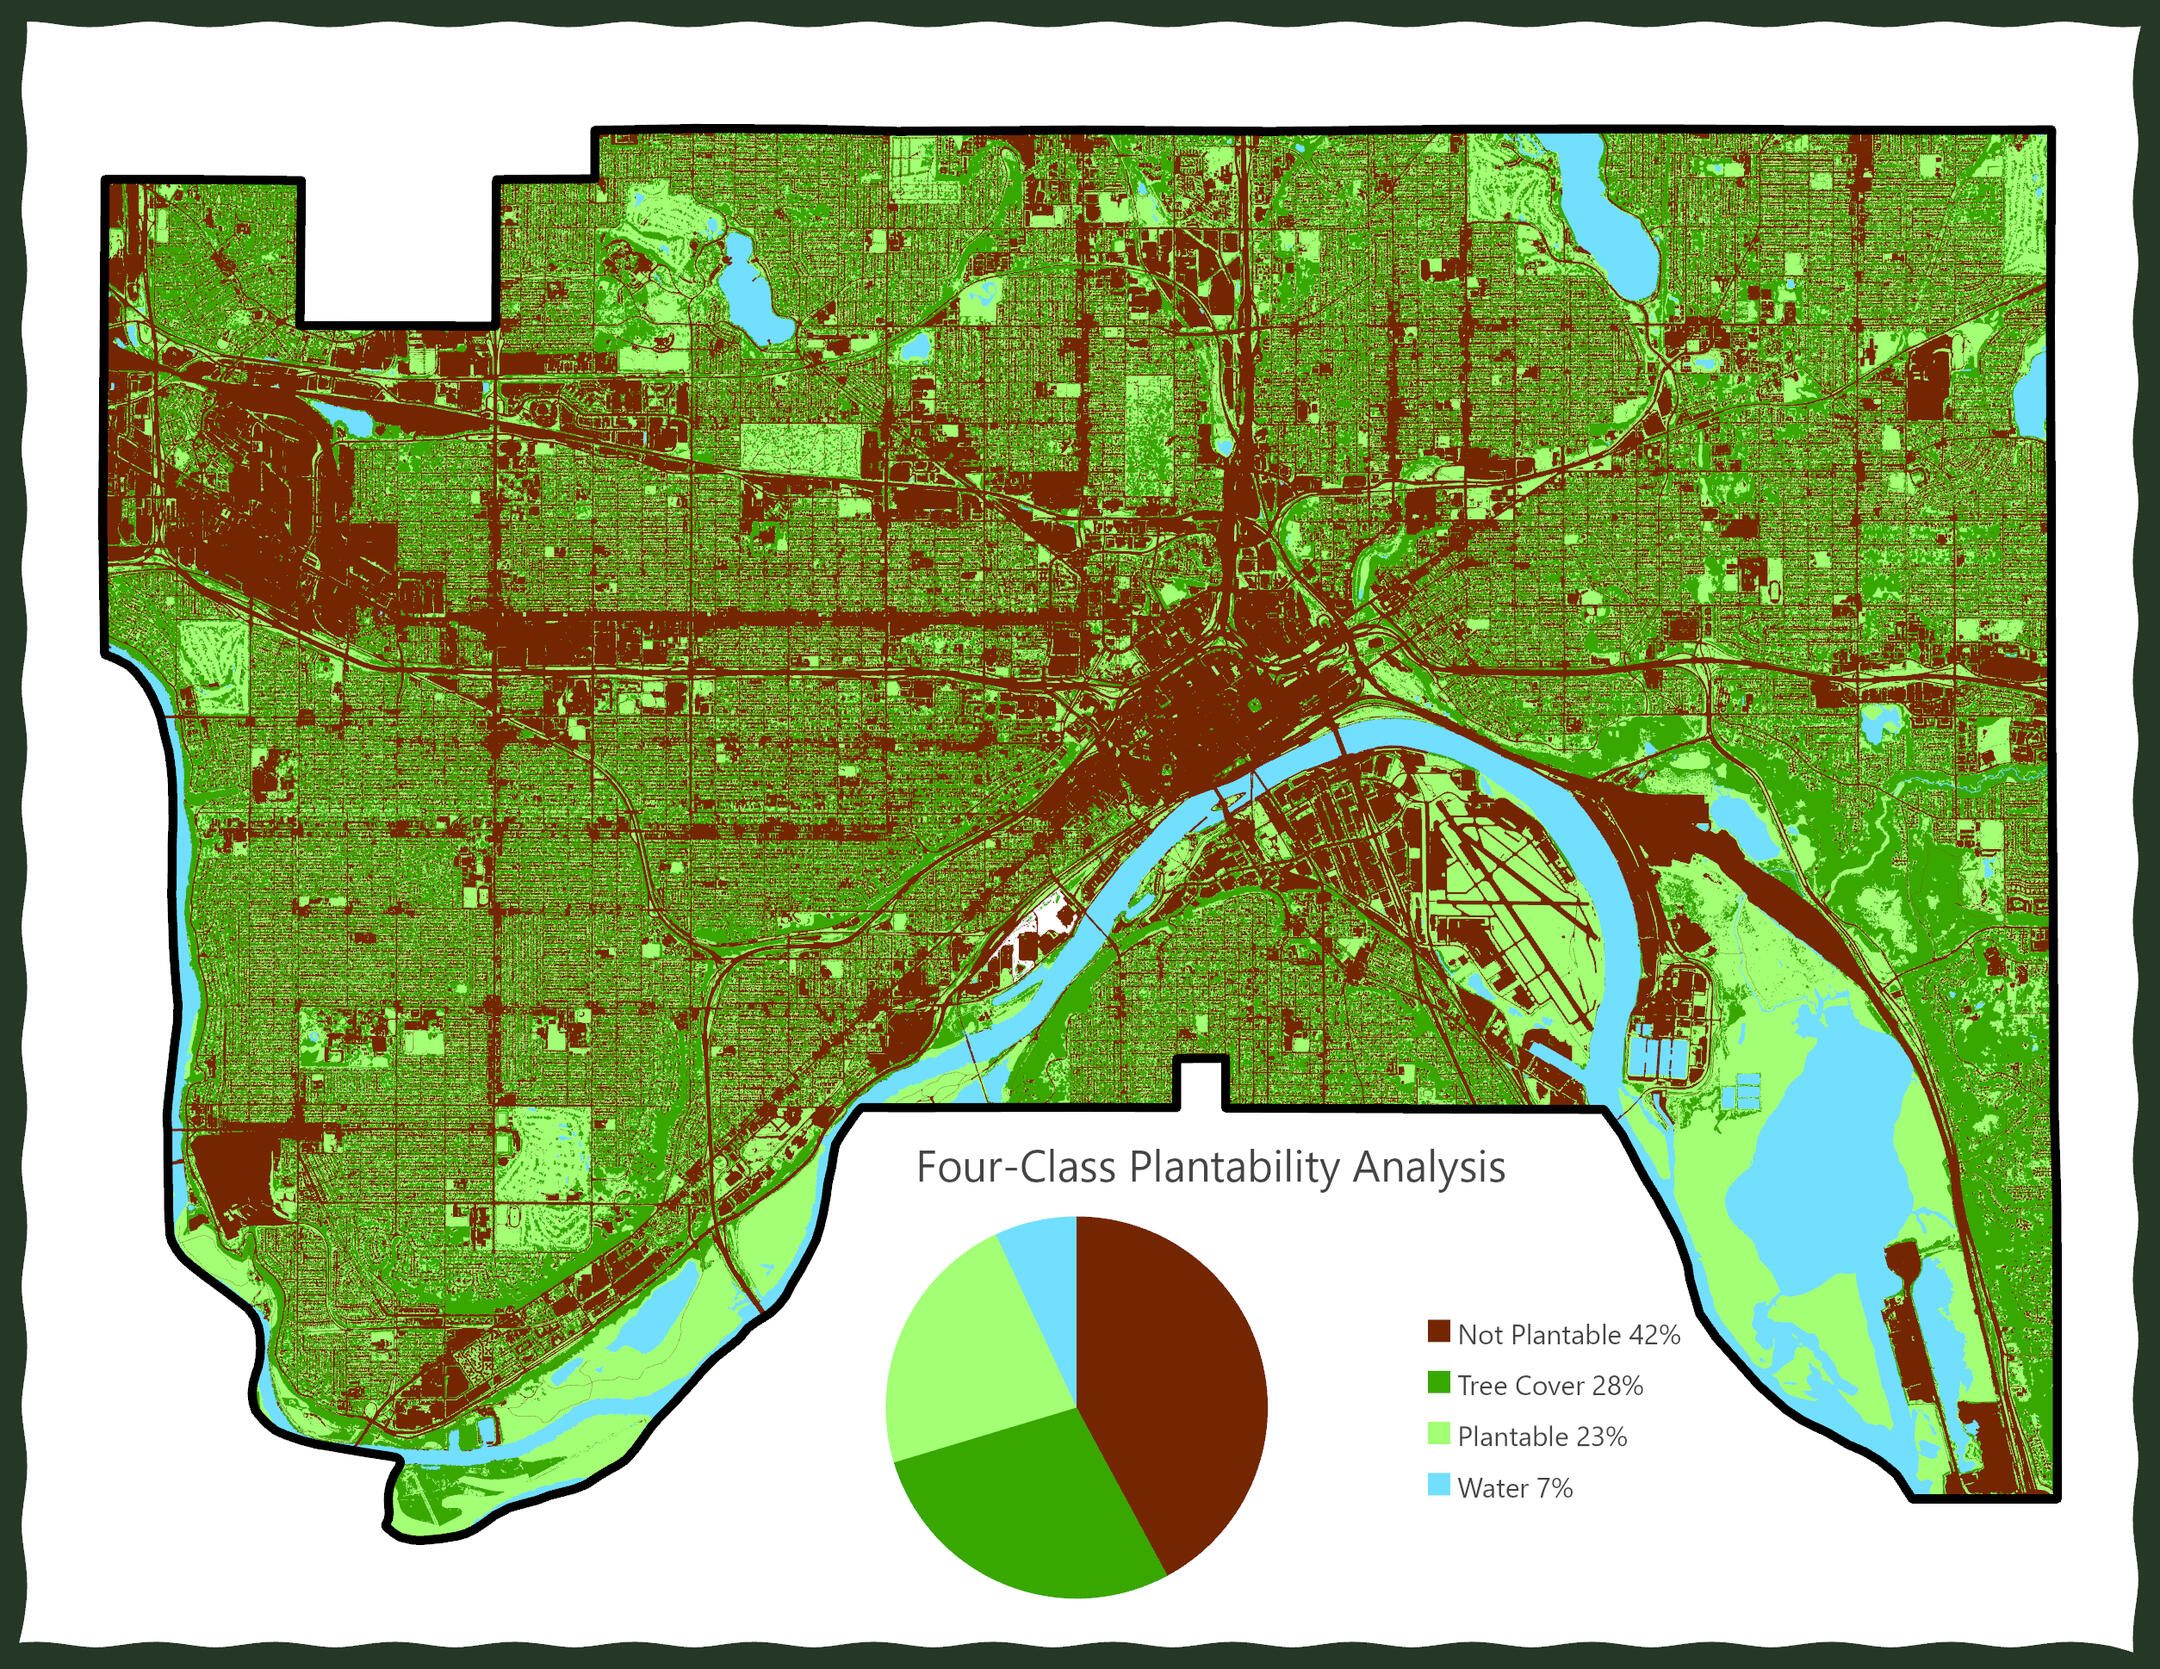
This GIS analysis estimates the amount of land in St. Paul that is realistically suitable for tree planting, taking into account both legal restrictions and cultural considerations. A secondary focus compares publicly accessible areas to those restricted by private ownership.Based on the most recent available data, approximately 71.5% of parcels in St. Paul are privately owned (about 18,300 acres), while 28.5% are public (roughly 7,300 acres). Using the original classification method from the Connecticut study, land in the city is categorized as 42% not plantable, 28% tree-covered, 23% plantable, and 7% water. While this seems comprehensive, a closer look at the underlying raster data reveals several limitations. For example, areas labeled as “bare ground” include baseball diamonds—clearly not practical planting sites. Grass, often marked as plantable, may represent anything from a golf course to a residential front yard or narrow boulevard strip. Additionally, the tree canopy data does not reflect recent changes, such as widespread ash tree removal.To improve accuracy, publicly available vector layers—sidewalks, rail corridors, recreational fields, buildings, and others—were incorporated to refine planting potential. Right-of-way areas were further clarified by subtracting paved surfaces to isolate viable green space.In the absence of consistent planting regulations across cities, a minimum baseline buffer was established to account for utilities, critical infrastructure, and, optionally, recreational zones. These buffers represent areas where planting is either restricted by code or discouraged by context. The final output combines these buffer zones with updated land classifications to produce a more grounded and defensible assessment of plantable urban space.The step-by-step process used to generate these results is summarized in the workflow below—detailing how inputs were layered, filtered, and refined to produce a realistic estimate of tree planting capacity. This model can be adapted by other cities looking to align planting potential with local policy, infrastructure, and cultural context.For an in-depth GIS analysis, please view the St. Paul Case Study.
Case Study: St. Paul, Minnesota
Guided by the Street and Park Tree Master Plan | All layers used in this study were either publicly available or provided by the City of St. Paul. The first step was to clip layers extending beyond the city boundary to improve processing efficiency.
Step 1: Preparation
1.1: Land Use Land Cover
Using the St. Paul Land Use Land Cover (LULC) layer from the Minnesota Geospatial Commons
the original four-class system was recreated by grouping raster values based on general land cover types. This classification serves as a baseline for comparison against an updated method that incorporates both municipal planting regulations and culturally-informed planting practices.
| Twin Cities Land Use (Original) | Twin Cities Land Use (4-Class, New) |
|---|---|
| Grass/Shrub 1 | Plantable - 1 |
| Bare Soil 2 | Plantable - 1 |
| Buildings 3 | Not plantable - 0 |
| Roads/Paved Surfaces 4 | Not plantable - 0 |
| Lake/Ponds 5 | Water - 3 |
| Deciduous Tree Canopy 6 | Tree cover - 2 |
| Coniferous Tree Canopy 7 | Tree cover - 2 |
| Agriculture 8 | Plantable - 1 |
| Emergent Wetlands 9 | Plantable - 1 |
| Forest/Shrub Wetland 10 | Plantable - 1 |
| Rivers 11 | Water - 3 |
| Extraction 12 *not present in St. Paul | Not plantable - 0 |
1.2: Parcel Ownership
Public land ownership was determined using two primary sources:- The Metropolitan Council's publicly owned parcels layer- The St. Paul parcel dataset from Ramsey CountyThese datasets were combined to generate a layer identifying publicly versus privately owned land within the city. This classification supports analysis of how much land is readily available for planting based on access and ownership.
 and **15 feet** (street lights).")
1.3: (True) Right of Way
The parcel layer was used to identify right-of-way (ROW) areas within St. Paul. All parcel geometries were subtracted from the city boundary to generate a generalized ROW layer. To refine this further, a “true right of way” layer was created by removing impervious road surface areas using the TCMA Road Surface 2022 dataset The result is a spatial layer representing ROW areas where planting may be feasible—excluding paved surfaces but retaining adjacent green space within the ROW.
 and **15 feet** (street lights).")
Step 2: Code & Culture Buffers
2.1: Code Based Buffers
The City of St. Paul’s Street and Park Tree Master Plan (see page 84) outlines planting guidelines for public rights-of-way. The snippets below outline that new trees can be planted along streets with the following buffer descriptions
| Location Details |
|---|
| Within 30 feet of a stop sign, traffic sign, or signal, nor within 15 feet of a street light. |
| Within 5 feet of identifiable underground gas utility nor within 10 feet of an underground water utility. |
| Within 10 feet of a fire hydrant, driveway, or utility pole. |
| On a street that does not yet have curb and gutters. |
 and **15 feet** (street lights).")
Although the plan identifies multiple buffer distances, only traffic signals and street lights were available as spatial data layers. As a result, two buffer distances were applied from the code:30 feet (traffic signals) and 15 feet (street lights).
2.2: Culture Based Buffers
In practice, St. Paul presents several planting limitations that are not explicitly addressed in the city's master plan or code of ordinances. The buffer distances used here represent a minimum standard for planting feasibility, taking both infrastructure proximity and spatial data limitations into account. For example, sidewalks are commonly represented as centerlines rather than full-width polygons. Although a sidewalk may only be 3 feet wide, the line geometry requires a wider buffer to account for the true physical space and additional clearance. In these cases, buffer distances were adjusted accordingly. The table below summarizes the layers used to represent cultural and spatial planting constraints, along with the buffer distances applied:
 and **15 feet** (street lights).")
| Layer | Geometry | Buffer (ft) | Reason |
|---|---|---|---|
| Sidewalks | Line | 4 | accounting for 1.5’ of sidewalk & 2’ buffer |
| Buildings | Polygon | 15 | |
| Bikeways | line | 10 | accounting for 4’ of bikeway and 2’ buffer |
| Rail Lines | line | 25 | accounting for 2.5’ of rail way and larger 22.5’ buffer |
| OSM Recreation | Polygon | 15 | accounting for safe spaces required around recreational locations. general buffer to denote where there will be planting unavailability |
2.3: Special Cases
The following layers represent areas that may be plantable under certain conditions but require additional caution or review. While their basic land cover types might suggest suitability, regulatory, operational, or contextual factors mean that each site must be evaluated more carefully. These locations are not assigned fixed buffer distances, but are flagged for further consideration during the planting suitability process.
 and **15 feet** (street lights).")
| Layer | Reason for Special Consideration |
|---|---|
| Wetlands | Wetlands may support planting, but are subject to strict regulations and permitting. In the original four-class system, all wetlands were treated as plantable, which may overstate feasibility. |
| Airfields | While airport runways are non-plantable, peripheral areas may support trees if they meet FAA clearance regulations based on plane size and approach paths. |
| OSM: Golf Courses | Trees are typically found on golf courses, but placement is highly controlled to maintain visibility and playability. |
| OSM: Graveyards | Cemeteries often allow tree planting, but placement must be done with respect and care due to burial layouts and maintenance needs. |
| OSM: Zoos | Trees are commonly integrated into zoo landscapes for scenery and animal habitat, though species selection and maintenance may be more constrained. |
Step 3: Analysis
The final analysis integrates all previously defined spatial constraints to identify land that is realistically plantable within St. Paul.
Code-based buffers: Derived directly from municipal ordinances and public documents (e.g., distances from traffic infrastructure or utilities).
Culturally-informed buffers: Reflect areas commonly avoided for planting due to practical or community use (e.g., bike paths, recreational fields, rail lines).
Two main buffer categories are applied:
All layers requiring a buffer are processed using the distance values outlined earlier. These buffers are combined to create a single exclusion layer where planting is either legally restricted or strongly discouraged.In addition, a layer of special cases (e.g., wetlands, zoos, cemeteries) is overlaid. These areas are generally considered potentially plantable, but require further review. Planting is only excluded in these zones where overlapping constraints exist—such as impervious surfaces or critical infrastructure.
 and **15 feet** (street lights).")
 and **15 feet** (street lights).")
The original four-class plantability model serves as the baseline land classification. The analysis proceeds with the following steps:
1. Apply and erase buffers from the original four-class land cover layer.
2. Recalculate total land area remaining in each class, especially what remains labeled as plantable.
3. Intersect with right-of-way (ROW) data to identify how much of the remaining plantable land is within accessible ROW space.
4. Intersect with parcel ownership data to assess the proportion of remaining plantable land on public versus private property.This process results in a refined, policy-aware, and contextually grounded map of where trees can realistically be planted within the city.
Step 4: Results
The combined impact of code-based and culturally informed planting restrictions significantly reduces the amount of land that can be realistically considered plantable in St. Paul. The summary of plantable spaces is as follows.
| Category | Acres | % of Total Land (calculated from 35,862.5 total acres) |
|---|---|---|
| Original Plantable | 8,135.40 | 22.7% |
| True Plantable* | 6,558.05 (2,388 special case) | 18.3% |
| Removed from Planting | 1,577.35 | 4.4% (of total) |
| % Decrease in Plantability | — | 19.4% (of original plantable) |
 and **15 feet** (street lights).")
Buffer Analysis
Total land removed by buffer constraints: 11,563 acres
Cultural buffers: 10,851 acres
(Primarily building setbacks and general-use exclusions such as sidewalks, bike paths, and rail corridors)
Code-based buffers: 711 acres
(Derived from municipal tree planting regulations, including required distances from traffic signals and streetlights)
Special Case Areas
Flagged for review: 5,445 acres
Includes wetlands, cemeteries, golf courses, airports, and similar spaces. These areas were not automatically excluded, unless overlapped by impervious surfaces or identified buffer zones.
Adjusted Land Cover Summary
After removing buffer zones and impervious special case areas from the original four-class model:
Not Plantable: 7,755 acres
Water: 2,387 acres
Tree covered: 7,891 acres
Plantable: 6,558 acres
Within this adjusted classification, parcel ownership breaks down to approximately 62.2% private (10,366 acres) and 37.8% public (6,297 acres).
Refined Right of Way and Ownership Considerations
Within the true right-of-way areas, approximately 812 acres are considered readily plantable.Excluding those right-of-way areas, the remaining plantable space is 52.7% publicly owned (2,845 acres) and 47.3% privately owned (2,553 acres).
*Result Interpretation and Caveats
These results represent the best available estimate of land currently free from policy, infrastructure, and practical planting conflicts. However, two important caveats remain:
Subsurface infrastructure data were not available, meaning underground conflicts may still exist in areas marked as plantable.
Special case areas were retained in the final plantable total unless they overlapped with known exclusions, potentially inflating the estimate in select zones.
This analysis should be treated as a high-level planning tool, subject to further refinement through site-specific review and evolving municipal standards.
Overall Limitations + Considerations
Buffer zones are not directional. Spatial buffers apply uniformly in all directions, but real-world planting contexts are not so simple. For example, a baseball field may allow trees behind the dugout but not in the outfield—something traditional buffers can't distinguish.
Land cover data is outdated. The most recent LULC datasets often date back to 2015 or earlier, limiting accuracy—especially post-canopy loss events like widespread ash tree removal.
Underground infrastructure is invisible. Critical utilities such as water, sewer, and electrical lines are not always mapped or publicly available, making it difficult to account for underground conflicts.
Raster data has limits. While useful for broad classification, pixel-based layers lack the precision of vector data—especially for fine-scale urban planting decisions.
Line features are not enough. Sidewalks, bike paths, and similar infrastructure are often mapped as centerlines, which don’t reflect their true width. Polygon representations are far more useful for assessing spatial conflicts.
Urban planting is not one-size-fits-all. Municipal needs and codes vary widely. Any decision-support tool must be adaptable and easily modified to reflect local context.
Buffer distances should consider tree size. A small-form tree presents less risk to adjacent infrastructure than a large-form tree. For example, the fall zone and root spread of a 5-foot ornamental tree differ significantly from a 25-foot shade tree. Tree form also affects sightlines—conifers may obstruct visibility more than deciduous trees.
Some regulations are vague. Municipal codes can be ambiguous, outdated, or incomplete when it comes to planting specifics—leaving critical decisions open to interpretation.
Methods & Maps
While this analysis is still a work in progress and plans to grow, you can find various versions on GitHub. Additionally, version updates /issues, recommendations, and guides will be posted here.
🌳 To Tree or Not To Tree – GIS Tool (v1.0 Beta) | Go >
This tool helps cities figure out where trees can actually be planted — based on land cover, legal rules, and common-sense limitations (like not planting in the middle of a baseball field). It uses open-source Python libraries (no ArcGIS license needed!) and outputs all results as shapefiles + an interactive web map.
🔍 What it does:
Classifies land into 4 types:
Plantable, Not Plantable, Water, and Tree Canopy
Lets you define “restricted” areas based on:
Code (e.g., utility poles, signs)
Culture (e.g., sports fields, sidewalks)
Buffers restricted areas and removes them from plantable land
Optionally breaks down planting space by ownership (public/private/ROW)
Saves all results to a folder + shows a simple map
🧰 What you need:
Your own land cover raster + restriction shapefiles
Python installed with:
geopandas, rasterio, shapely, folium, numpyA Jupyter Notebook environment (like VS Code, Anaconda, etc.)
📦 Outputs go to _exports/
Final plantable zones
Special cases (like golf courses)
Code/culture buffers
Summary stats
Web map to view results
📝 Notes
This is v1.0 Beta — fully functional but still being tested & worked for bugs
The code is full of ‼️ and comments to help you edit without stress
Built for clarity, not complexity — no charts, just data and maps
📄 License & Attribution
Made with ❤️ by Leah R.
This project is open source and shared under the MIT License
Feel free to remix, reuse, and expand — just give credit!
Credits
Research Team
Leah Rumon | Technical Author
University of Minnesota: Master's of Geographic Information Science Student. Portfolio >
Yumi Kashihara | 樫原佑実 | Research Author
University of Minnesota Master's Student | Natural Resources Science & Management
Dr. Alicia Coleman | Advisor & Original Researcher
Assistant Professor, University of Minnesota Department of Forest Resources
Thanks
A special thank you to the City of St. Paul for providing data on above-ground infrastructure.
Data Sources
| Layer | Source |
|---|---|
| St. Paul Land Use Land Cover | TCMA 1-Meter Land Cover Classification |
| Public Parcels | Met Council Public Parcels |
| Bikeways | Bikeways in Minnesota |
| Rail Lines | MN Rail Lines |
| Wetlands | MN Wetland Inventory |
| OSM POI Data | GeoFabrik Download |
| Sidewalks | St. Paul Sidewalks |
| Streets | St. Paul Streets |
| Road Surface Area | 2022 Road Surface Area |
| Street Lights & Traffic Signals | Provided by the City of St. Paul |
Bibliography
These sources are not formally cited within the technical narrative of this document, but were used to inform the baseline planting distances applied throughout the GIS analysis. Each reference offers guidance—whether codified, recommended, or observed—on safe and practical vegetation setbacks in urban environments. Together, they helped shape a conservative yet realistic framework for identifying feasible planting zones in St. Paul.
| Information | Importance | Link |
|---|---|---|
| Street and Park Tree Master Plan | The City of St. Paul's guide to planting & caring for trees, along with guidelines for planting (6.3, pages 83 & 84) | St. Paul Master Plan |
| ANSI A300 Tree Care Standards | Part 6: Planting and Transportation & Part 7 Integrated Vegetation Management. | TCIA & ANSI 300 |
| Railway Corridor Vegetation Management - Vermont | Page 7 & 8 Bank Maintenance. Typically, rail lines have universal/countrywide standards. | Vegetation Control on Railway Tracks and Grounds |
| USDA Conservation Buffers | General Information on conservation buffers & various benefits of planting. | Conservation Buffers - USDA Forest Service |
| SportsField Management | Information about best practices with vegetation around sports fields. | Maintaining the Trees and Shrubs at Sports Fields and Facilities |
| Bikelane Planting & Buffers - Seattle Example | Speaks to the importance of a minimum 3' horizontal clearance from trees. Additionally, references the potential for root system infiltration & benefits of trees & pathways | Seattle ROW Improvements Manual |
| Planting & Pools | AQUA Magazine for pool professionals speaks to the importance of minimal root systems, debris and the safety of trees with thorns or spikes around pools. | Poolside Planting |